Your Event Inbox
Event inboxes allow you to easily view key data and trends about flagged events for each different type of surveillance exception.
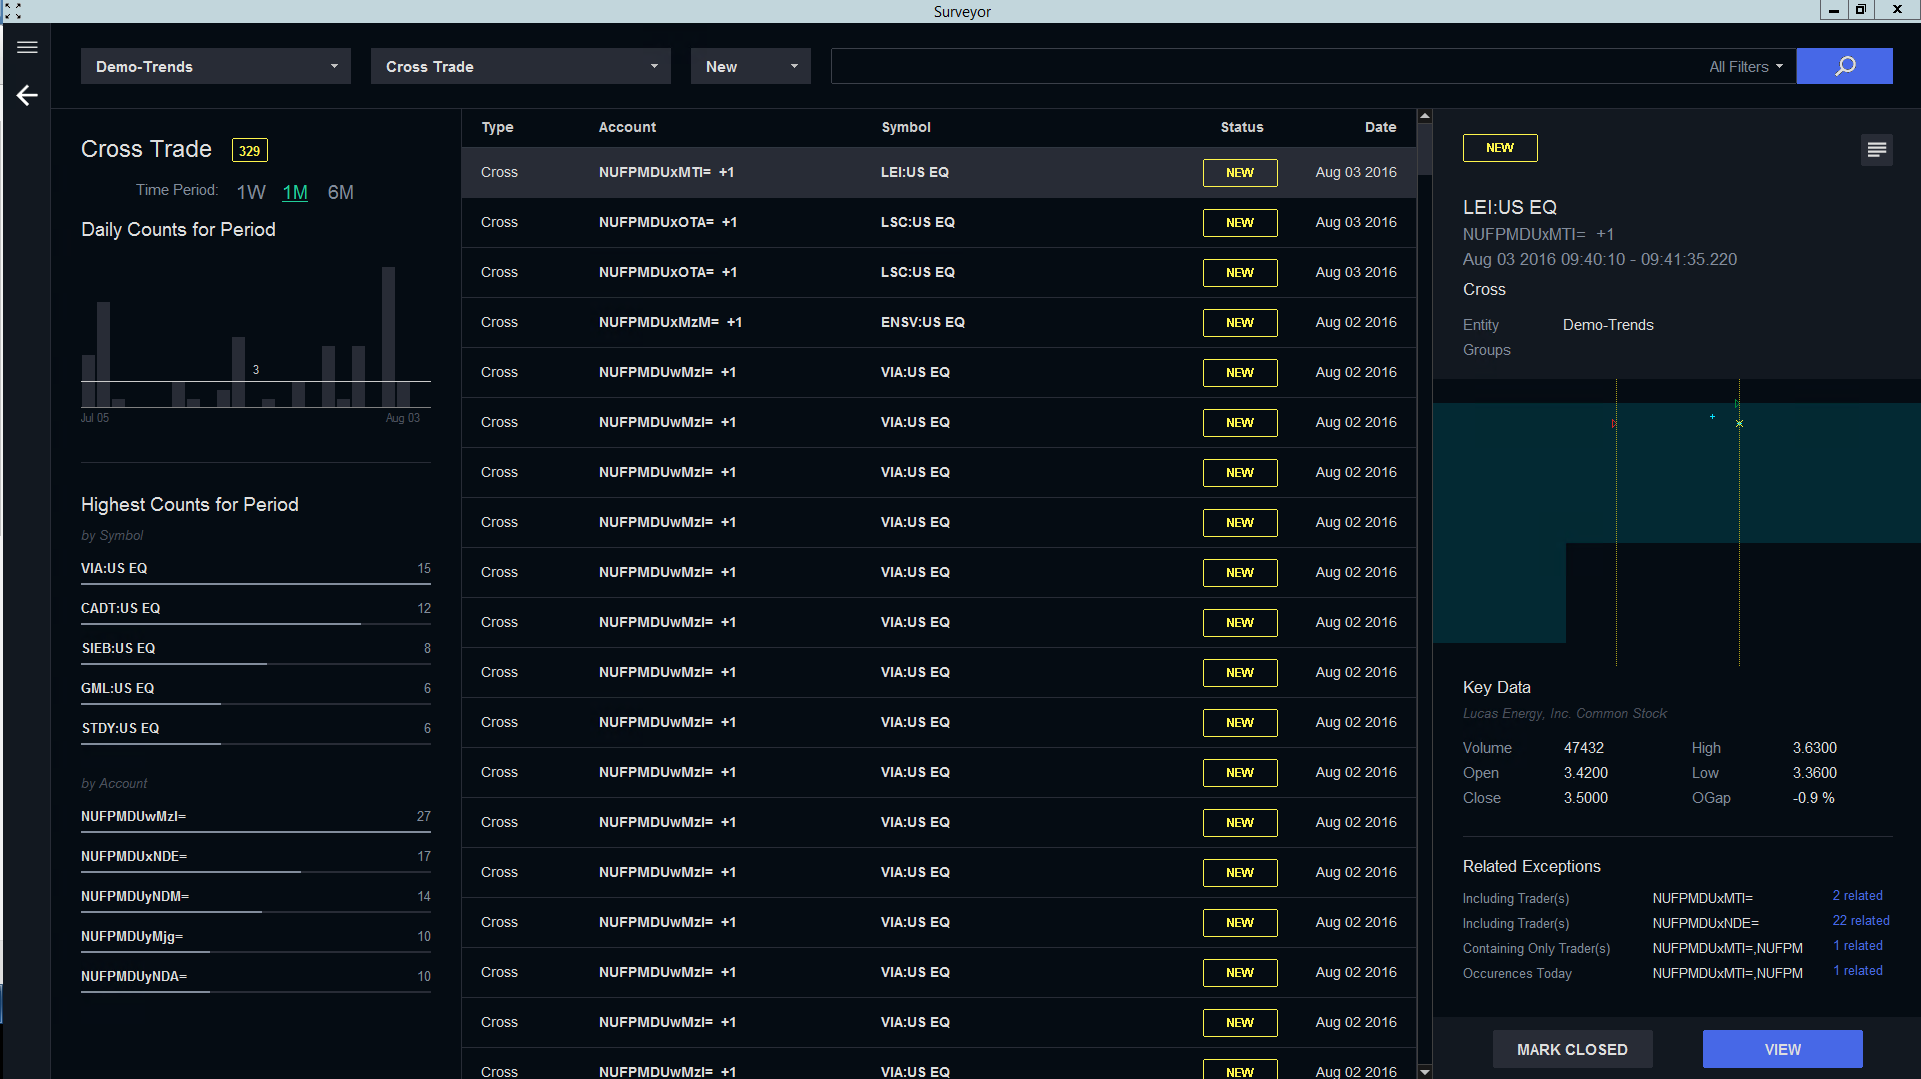
Reading the Inbox
In the top left corner, a bar graph shows the number of events over different time periods. The average over the period is shown by a white line running horizontally.
Underneath the bar graph, tables show the most active symbols and accounts for the type of exception you specified.
In the middle pane of the inbox are all of your surveillance exception events for the type of exception you specified. Click on an event to generate a summary in the right-hand panel. The summary includes a small graph, key data on the stock for that day, and related exceptions.
Sorting and Filtering the Inbox
You can sort and filter the contents of your inbox using any of:
- the Entity, Event Type, and Review Status drop down menus on the top left,
- the All Filters drop down menu on the top right,
- clicking on any of the blue Related Exceptions links in the summary pane on the lower right,
- clicking on any of the symbols or accounts in the Highest Counts section on the lower left, or
- entering any relevant search terms (symbols, account numbers, dates, etc.) in the free-form search bar on the center top.
Reviewing Events
You can learn more about the types of surveillance exceptions Surveyor detects, or see how you can review events for each type of exception.